The dispatch system can use Google Maps, Google Earth, or open maps to display your resort. However many of these systems do not have current information about your buildings, lifts and runs.
To add a better set of data to Medic52, we allow an overlay of your mapping data to be placed in the dispatch system.
Don’t have a digital version of your map from a GIS system? No worries – you can create one yourself that is good enough for ski patrol purposes, then come back to this page to convert it for Medic52.
To create a suitable file export your mapping data to GeoJSON. If you cannot do so, export it to KML, then use this conversion tool: KML to GeoJSON Converter. Note that a few issues can occur here, depending on the complexity of the KML. We found that having nested Document tags doesn’t help, but folders are ok. Play with it and see what you come up with.
Separating Buildings, Lifts and Runs
Here are the data types we love on our maps, because it’s all useful, and helps with finding a patient accurately if they are on the phone.
- Buildings – Point or Polygon (see below for more info)
- Lifts – LineString
- Runs – LineString
Your final GeoJSON file should contain three JSON blocks. These are converted into layers on the final map view. These three blocks should then be converted into one single file for upload.
Styling the lines
KML Files define a StyleURL element, and this is often consistent across your Placemarks – i.e. Blue runs will all have the same style, and another for Black runs etc. When you convert to GeoJSON, we do a find and replace on these, and set them up as styles that are used to colour the rendered lines on the map. Example in KML:
<styleUrl>#LineStyle00</styleUrl>
After conversion:
“styleURL”:”#LineStyle00″
Final GeoJSON:
“rating”: “blue”
Run Rating values:
- green (solid green line)
- red (solid red line)
- blue (solid blue line)
- doubleblue (dash dot dot dash blue line)
- black (solid black line)
- doubleblack (dash dot dot dash black line)
Polygon Buildings are in a blue filled in polygon, and Lifts are long dashed Red. If you don’t like our styles, you can add some code to the top of your GeoJSON file to alter the styles, per the Leaflet Path documentation.
Buildings – Point vs Polygon
Another point to note is the difference between a point and a polygon on buildings. As shown in the examples below, a point has a marker, but a polygon is a shaded area. Both can have clickable descriptions popup, but the markers tend to get in the way when zoomed out, so please bear this in mind when creating your map file.
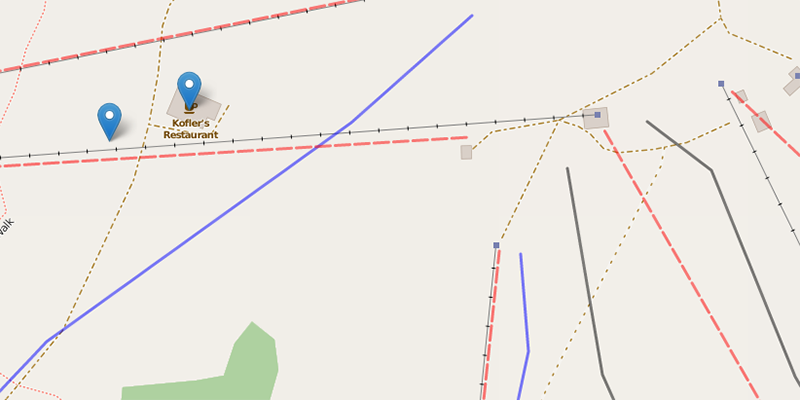
Map overlay showing buildings as points
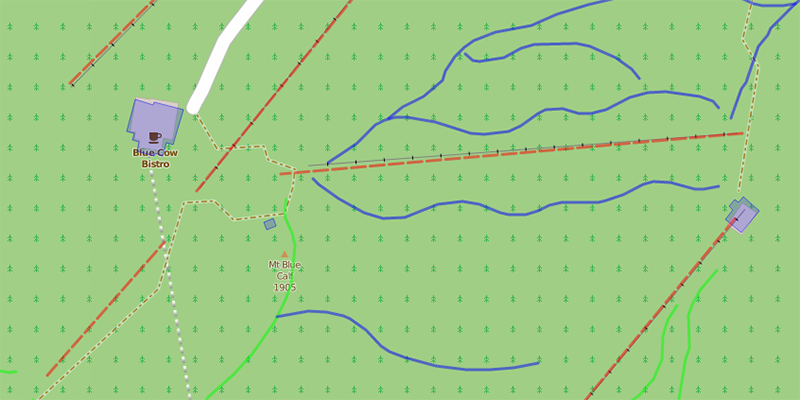
Map overlay showing Polygon of the building
The final file
And here is the final file. Note that the styles are optional, and if you do not declare them our default styles will apply.