We have released a big update today benefiting ski patrol dispatchers, ski patrollers and risk managers. This update is largely driven by customer and user feedback, and we would like to say thank you for all the input.
Patrollers:
When editing an incident we have added a Next button at the bottom of each tab, making it easier to get to the next tab in one click. No need to scroll and click now.
The maps now have your resort overlay on it. If you don’t have one, follow the instructions to create your own map.
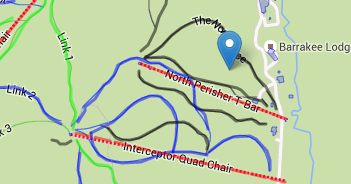
Maps can now also be blown up to full screen, allowing you heaps more detail and play space to get the right spot if you need. We added Terrain / Satellite views here too, and also made the pin drop accessible via click / hold (iPad) drag / drop (desktop).
PDF output of incident forms is now in A4 / US Letter depending on your resort settings.
The spinners and mouse rolling feature provided by HTML5 inputs have been disabled to make it easier to use a scroll wheel on incident input pages.
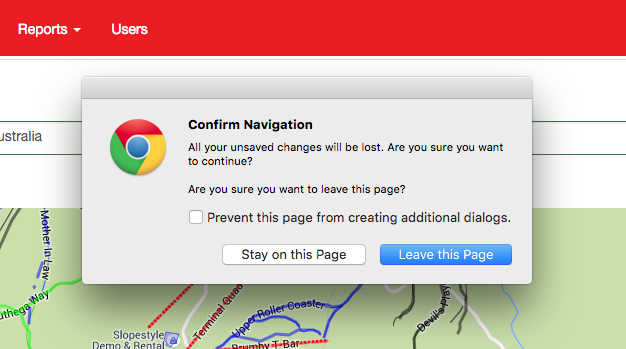
A significant change is trying to leave the edit incident page when you have made a change, but not hit save yet. You will now be prompted to save, before leaving the page, so no more accidental lost changes.
The incident can now have unit specific fields for height, weight, temperature, distance and length. This shows you the field in miles (if that is your default) and clicking on the units will change and convert it to kilometres. So if you have a patient tell you their weight in kilograms but you use pounds, you simply swap over, enter it and swap back to show the pounds conversion. (Note this will become available after Apple & iOS apps are available in the stores)
Dispatchers:
We have removed the delay when you create an incident on the dispatch map. This allows you to immediately start adding notes without having to wait for the popup.
You can now drag and drop the pin on the map when you are ready to any location. This means even if you start the case in the wrong location its easy to move it.
Managers:
You are now able to choose the scale of a timeline or bar chart, and select a grouping of the data in days, day of week, week, week of year, months, or year. This will allow you to find trends a little easier by having the system do the hard work.
You can also download chart data in to a CSV.
We fixed the heat map rendering.
0 Comments
Leave A Comment